Traditional plant breeding is based on combining interesting phenotypic traits from two races or varieties into new cultivars. In modern breeding, successful cross-over is assisted and facilitated by genetic markers (marker assisted selection). A commonly used genetic fingerprinting technology is Amplified Fragment Length Polymorphism (AFLP), where selectively amplified whole genome restriction fragments are separated via electrophoresis into a complex band profile. The occurrence of specific bands can be linked to the presence of particular phenotypic traits. In diploid organisms however, a phenotypic trait can be homozygous or heterozygous, which in theory will result in marker bands that can have double or single intensities.
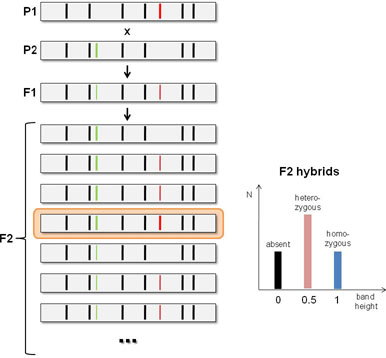
 Consider a mating experiment (see figure) with two parent lines (P1 and P2), each having a desirable genetic marker that one would like to see homozygously combined in the offspring. The P1×P2 mating will result in an F1 offspring that is heterozygous for both markers. The subsequent F1×F1 cross generates F2 offspring, displaying segregation of the DNA markers. For each of the heterozygous markers in the F1 generation, there is 25% chance that this marker will be absent, 50% chance that it will be heterozygous and 25% chance that it will be homozygous. For the two unlinked genetic markers in the present example, there is a 6.25% (or 1 out of 16) chance that both markers are homozygous in the F2 offspring, i.e. that both desired properties inherited from P1 and P2 are “pure” (highlighted in the figure).
In practice, however, the band height distribution differs from the situation depicted in the figure. This is due to differences in intensity between lanes (e.g. caused by variations in DNA concentration applied) and intensity differences along the run length (e.g. the typical “ski-sloping” observed in electropherograms from a capillary sequencer). Therefore, the band heights need to be normalized within and between lanes before they can be scored as homozygous, heterozygous or absent, and the scoring itself needs to be approached in a statistical way.
Codominant scoring of AFLP markers in BIONUMERICS
The BIONUMERICS software uses its proven concept of fingerprint normalization to enable the generation of unlimited databases of AFLP profiles that are all accurately aligned to one global reference system. The reference positions making up the reference system can either be bands from a dedicated marker set, or a set of common bands on all AFLP profiles. As a result, thousands of AFLP profiles stored in the database can be compared with each other, which eliminates the need for including reference samples in each run or gel. When AFLP patterns are obtained via capillary electrophoresis, BIONUMERICS offers a fully automated workflow for pattern normalization, peak search and sample documentation.
Automated assignment of genetic markers
Genetic markers can be stored in the database as band classes, which can be assigned a name, e.g. the phenotypic trait they correspond to. Any set of AFLP profiles from the database can be analyzed together in the Comparison window, where the assignment of specific bands to the marker classes happens in an automated way. Using easy drag-and-drop functions and/or keyboard shortcuts, the user can easily assign/unassign bands or reassign bands to a different DNA marker class.
The user can add or delete bands at any selected position in the comparison and save all modified band information in all affected gels/runs with a single command. The multi-step undo/redo function and the stepless zoom sliders make editing bands and marker assignments even more convenient.

Calculation of zygosity
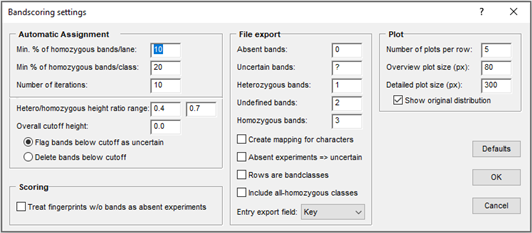
In terms of zygosity, all bands are initially scored as "undefined". Using a few known uniformly homozygous bands, an iterative 2-way normalization over the entries and band classes is performed. This normalization is stored along with the band matching. The bands are subsequently scored into one of the following five states: absent, uncertain band, heterozygous, undefined zygosity, and homozygous. The normalization and scoring settings can be adjusted (see figure).


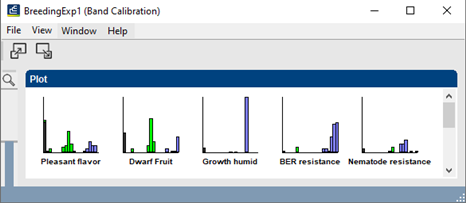
 The automatic band assignment can be monitored and further refined using the band class calibration plots (see below).
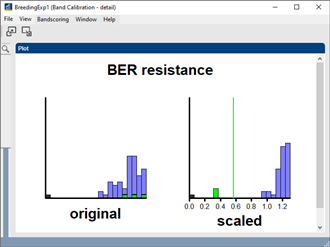
For each DNA marker, the user can double-click on the plot to open a detailed plot, displaying the original distribution of the peaks (left) and the distribution after iterative 2-way normalization (right). On the figure, absent bands are black, heterozygous bands are green and homozygous bands are blue. The user can redefine the limits between uncertain, heterozygous, undefined and homozygous directly on the plot.
Customized reports can be generated as tab-delimited text files, containing user-defined characters for different zygosity states (see figure "Bandscoring settings"). Once assigned, the zygosity state for each band of each profile is stored in the database. New profiles can be compared with previously analyzed profiles, which can be used as references for enhanced band scoring.
This application is implemented in BIONUMERICS as the Band Scoring plugin which is license-based. Please contact us for licensing information.
