Bacterial isolates can be tested for antibiotic resistance using several methods. Antimicrobial susceptibility is thereby expressed either as a Minimum Inhibitory Concentration (MIC), determined via serial dilution or Etest, or as an inhibition zone diameter when determined via the disk diffusion method. Using the Antibiotics susceptibility plugin in BIONUMERICS, cut-off values can be set and antibiotic resistance data are automatically converted to SIR categories (Susceptible, Intermediate, Resistant), which can then be used for calculating dendrograms and to perform statistical analyses on.
Antimicrobial susceptibility profiling in BIONUMERICS
Adding breakpoints
In order to convert inhibition zone diameters or MIC values into SIR categories, cut-off values need to be defined for the organism under study. Such breakpoints are published for clinically relevant organisms by the Clinical and Laboratory Standards Institute (CLSI). However, for non-clinical isolates, it can occur that CLSI guidelines are not available and that one is forced to use breakpoints of related species. To evaluate different sets of cut-off values or in case CLSI breakpoints are revised, the original zone diameters or MIC values can easily be re-interpreted by the plugin.
Import of inhibition zone diameters and MIC values
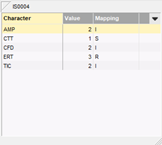 The antibiotics resistance data for a large number of isolates can be easily imported in the database from a text file, MS Excel spreadsheet or any ODBC-compatible data source (e.g. MS Access, MS SQL Server, Oracle, MySQL, etc.). During the import, the data are automatically converted to SIR categories using a decision network. The data for each isolate are displayed in the experiment card, with the values left and the corresponding mapping on the right hand side.
Cluster analysis and statistics
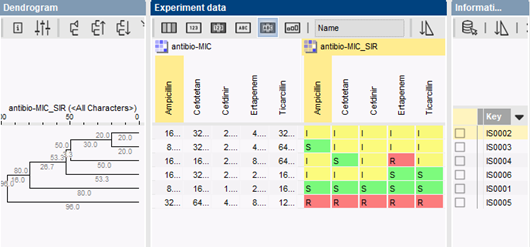
Isolates are typically clustered based on their resistance categories using a categorical coefficient, which treats different values as different states. The colors in the comparison window correspond to the color of each antibiotic category (susceptible, intermediate or resistant). MIC values are shown in the central panel. Clusters can be used to create working groups for hypothesis testing. Groups can also be created based on information fields in the database (time of isolation, geography, patient type, hospital, etc.).
The availability of relevant charts and statistical tools in BIONUMERICS, together with proper visualization of data and correlations, facilitates trend detection and prediction of future evolutions in bacterial drug resistance.